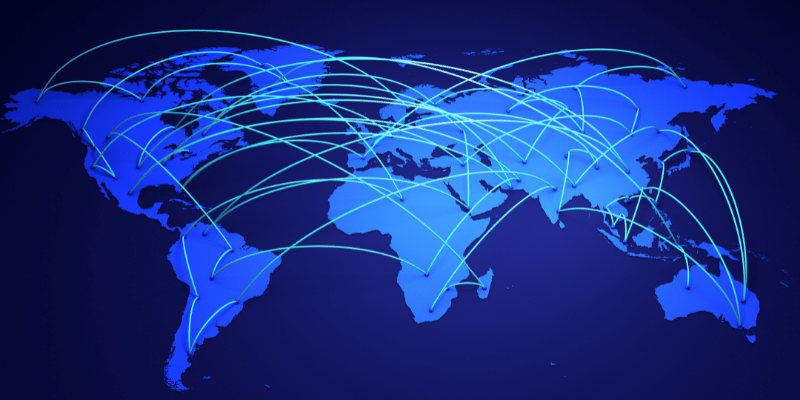
1. Introduction
Geographic Information System (GIS) is a computer system that analyzes and displays geographically referenced information. It uses data that is attached to a unique location. A GIS system creates, manages, analyzes, and maps various types of data. GIS connects data to a map, integrating location data (where things are) with all types of descriptive information (what things are like there). This provides a foundation for mapping and analysis that is used in science and almost every industry. GIS helps users understand patterns, relationships, and geographic context. The benefits include improved communication and efficiency as well as better management and decision making.
2. Example use cases of GIS
A geo spatial engineer uses modern mapping technologies, such as GIS and GPS, to map, collect, and analyze geographic data.
Use case 1: – A rare plant is observed in three different places, and GIS analysis might show that the plants are all on north-facing slopes that are above an elevation of 1,000 feet and that get more than ten inches of rain per year. GIS maps can then display all locations in the area that have similar conditions, so researchers know where to look for more of the rare plants.
Use case 2: – By knowing the geographic location of farms using a specific fertilizer, GIS analysis of farm locations, stream locations, elevations, and rainfall will show which streams are likely to carry that fertilizer downstream.

3. What is Orthorectification / Orthophotography / OrthoImages
Orthorectification is a subtopic of geo referencing. It is the process of converting raw images into a form suitable for maps by removing sensor, satellite/aircraft motion and terrain-related geometric distortions from raw imagery. Imagery has an amazing amount of information, but raw aerial or satellite imagery cannot be used in a GIS until it has been processed such that all pixels are in an accurate (x, y, z- geo coordinates) position on the ground.

4. GIS data capturing techniques

4.1: Primary GIS Data Capture Techniques
Primary data capture technique uses remote sensing and surveying technologies to capture the data using either raster data capture or vector data capture. The vector GIS data capture technique includes capturing of datasets through physical surveying techniques (this is time consuming and expensive)
4.2: Secondary GIS Data Capture Techniques
Automatic raster to vector conversion is a great example of advancement of the technology; it uses special software using intelligent algorithms that have been developed to recognize the patterns of the points, lines and polygon features and capture them automatically to generate vector GIS data.
5. GIS data generation, visualization and processing tools
Modern digital cameras will embed GPS coordinates into the photos/videos. Also, there are techniques to manually embed this geo metadata as well. Below is a list of GIS software tools.
- Geosetter – This tool can embed GPS coordinates into camera images
- ArcGIS – tool for visualizing and orthorectification
- Google Earth Pro – Google Earth enables you to travel, explore, and learn about the world by interacting with a virtual globe. You can view satellite imagery, maps, terrain, 3D buildings, and much more.
- Google Earth Engine – the code engine of Google Earth. Enables analyzing geospatial information.
- Google Maps API – Google Maps API is a mapping platform that includes driving directions, Street View imagery etc.
- QGIS – is an open-source GIS tool that provides capabilities and tools to help you visualize, manage, edit, analyze data and compose printable maps.


Fig 5: GIS data visualization and processing tools
6. GIS data formats – Raster and Vector
Raster and vector are two very different but common data formats used to store geo spatial data.

- Vector data use X and Y coordinates to define the locations of points, lines, and areas (polygons) that correspond to map features such as fire hydrants, trails, and parcels. As such, vector data tend to define centers and edges of features. Eg: KMZ (.kmz) Image file
- Raster data, on the other hand, uses a matrix of square areas to define where features are located. These squares, also called pixels, cells, and grids, typically are of uniform size, and their size determines the detail that can be maintained in the data set. Eg: Geo Tiff (.tif) Image file
7.1. GIS data format – Geo Tiff (.tif)
GeoTIFF files are raster image file types that are commonly used to store satellite and aerial imagery data, along with geographic metadata that describes the location in space of the image. GeoTIFFs are compatible with nearly all CAD and GIS applications and maintain their quality when compressed, edited, and transferred. Basically, rasters are grids (or “bitmaps”) of pixels that, when combined, depict an image. The more pixels used to recreate a single image, the more defined that image will appear. TIFFs come in a “lossless” format. So, for things like aerial surveys with geo spatial data that need to remain intact no matter how many times they’ve been compressed, copied, edited, and uploaded to different applications, .TIFFs make the perfect container. A sample .tif file is shown below:

In drone surveying, there are two primary visual outputs that can be saved as GeoTIFFs:
- Digital elevation models (DEM)
DEM GeoTIFFs list the vertical point (z) recorded for every horizontal coordinate (x,y), in addition to all the Coordinate Reference System information necessary to place them in greater spatial context.

- Orthophotos
An orthophoto is a two-dimensional, overhead image of the surveyed area. Orthophotos are different from unedited drone-captured images as they’ve been corrected for perspective, lens distortion, topographic relief, and camera tilt. Basically, every point on an orthophoto is shown as if the drone that captured it was exactly perpendicular to the surface when the image was captured.

7.2 GIS data format – KMZ (.kmz)
A KMZ file is a placemark file used in Google Earth and Google Earth Pro. Since KMZ files contain latitude and longitude coordinates, as well as 3D model data, they can be used in GIS environments to digitally represent real locations of the Earth. You can use Keyhole Markup Language (KML) files to view and share Google Earth information. These files store geographic data and content associated with Google Earth. The KMZ file format supports both vector data (lines, points, polygons, triangles etc.) and raster data (images). A KMZ file consists of a main KML file and zero or more supporting files that are packaged using a Zip utility into one unit, called an archive.

8. GIS data visualization tools
8.1 Google Earth Pro
Installation:
https://itsfoss.com/install-google-earth-ubunu/
Visualizing a sample tiff in Google Earth Pro:
https://surveyorinsider.com/import-geotiff-into-google-earth-pro/
Note: If the GeoTIFF file is large, Google Earth Pro will prompt you with 4 options on how to handle a large image.
1. Create Super Overlay: This will split up the file into multiple *.kmz files.
2. Scale: This reduces the image size to the maximum supported size.
3. Crop: If you want to reduce the actual size of the image and view only a subset of the image.
4. Cancel: Nothing will happen and you won’t get to see your image in Google Earth Pro.

8.2 Google Earth Engine
Google Earth Engine is the code engine of Google Earth. Google Earth engine plugin can also be integrated with QGIS. To use this plugin, we must be an authorized user in Google Earth Engine. Login to Google Earth Engine and sign up.
https://code.earthengine.google.com/
Google Earth Engine is a cloud-based geospatial analysis platform that enables users to visualize and analyze satellite images of our planet. Scientists and non-profits use Earth Engine for remote sensing research, predicting disease outbreaks, natural resource management, and more. Google Earth Engine has many python packages which can be used to visualize and process images having geo spatial information.

Google Earth Engine python packages

9. GIS data processing using python
- gdal
gdal package modules to get the latitude and longitude for a given pixel position. As we know, in tiff files of datatype orthophotos, we won’t have elevation information in the geo spatial metadata (elevation information is captured for DEM type files). - rasterio
This package we can use for printing the image metadata. Our tiff files have 4 bands – RGBA (A-alpha/transparency). We can visualize 4 bands separately using rasterio - rioxarray
This package can be used for printing image metadata.
10. Elevation APIs
For tiff files of datatype orthophotos, we won’t have elevation information in the geospatial metadata (elevation information is captured in DEM type files); we need to explore how to find the elevation for a given (latitude, longitude). Multiple elevation APIs are available and we tested 3 APIs (including Google Elevation API) and one python package which could help us in predicting the elevation for a given (latitude, longitude).
- Google Elevation API
- To call this API we need an authentication key
- Open Elevation API
- Open Topo Data API
- Altitudo python package
While testing and comparing the results with the actual elevation from Google Earth Pro GUI we could determine that only Google Elevation API was consistently returning accurate elevation values.
11. Mapping image pixel coordinates to latitude, longitude, elevation
We developed a python utility that can take a set of (x, y) pixel coordinates from an input image and using the packages and APIs mentioned in the previous sections, generate a ‘position-on-the-planet’ (latitude, longitude & elevation) for that pixel. A sample output (in csv format) from this utility wherein it processes multiple input images and captures corresponding (lat, long, elevation) is shown in the figure below.

12. Conclusion
Thousands of organizations in virtually every field are using GIS to make maps that communicate, perform analysis, share information, and solve complex problems around the world. This is changing the way the world works. Here we introduced the basics of GIS data and its formats, visualization and processing techniques. Our next step is to do some automated position mapping on artifact detection using the best available GIS processing techniques and APIs.
In part 2 of this series, we’ll describe how the GIS data mapping techniques described above is combined with the deep learning algorithms of Ignitarium’s TYQ-i™ platform to automate Positive Train Control (PTC) mapping around railway tracks.
References:
https://www.usgs.gov/faqs/what-geographic-information-system-gis
https://opentextbc.ca/geography/back-matter/tools-for-spatial-data-collection-and-utilization/
https://www.g2.com/categories/gis
https://spatialthoughts.com/2020/04/04/ndvi-time-series-gee-qgis/
https://itsfoss.com/install-google-earth-ubunu/
https://mapasyst.extension.org/what-is-the-difference-between-raster-and-vector-data/
https://gisgeography.com/gis-formats/
https://surveyorinsider.com/import-geotiff-into-google-earth-pro/
https://gdal.org/tutorials/osr_api_tut.html
https://rasterio.readthedocs.io/en/latest/quickstart.html
https://www.youtube.com/watch?v=zgAXPyU3euo
https://www.youtube.com/watch?v=Kq92IkiA4PM
https://www.esri.com/about/newsroom/insider/what-is-orthorectified-imagery/
https://saylordotorg.github.io/text_essentials-of-geographic-information-systems/s09-geospatial-data-management.html