Introduction
This article describes a complete embedded vision system that enables automatic measurement of analog meters. Specific use cases include analog meters installed at weigh bridges, gas plants, electricity generation plants and a host of other industrial shop floors. These legacy meters do not have any means of external communication (wired or wireless) that would allow the readings to be transported to remote locations. Hence, it is necessary for humans to physically access each meter and take readings manually. Additional constraints in these plants include highly constrained – and often hazardous – physical spaces and non-availability of external power sources.
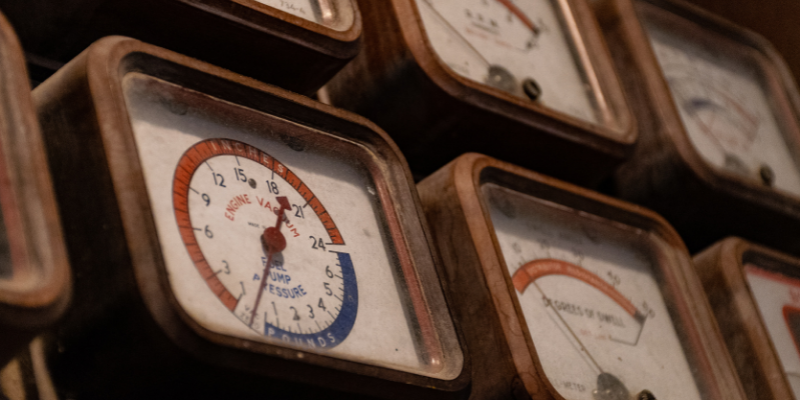
Figure 1. shows examples of legacy analog meters installed in factories and a proposed human-less meter reading system that can transport readings wirelessly in a self-contained battery-powered form factor.

Analog Meter Recognition System
To mitigate the above mentioned challenges, we have developed a low-power battery operated FPGA based analog meter recognition (AMR) system, implementing a complex image processing algorithm. The target use case described is a weight measurement system wherein automatic measurements in a range between 0 to 2000 grams is done with 10g accuracy. The system is implemented on a Lattice iCE40 UltraPlus FPGA Mobile Development Platform (MDP) as shown in Figure 2.

AMR Workflow
The AMR workflow consists of three stages as shown in Figure 3.
- First is image capturing from the MDP board using the OVM7692 image sensor and capturing the results. The captured results are further passed as input to a python script to generate images representing the weight range from 0g to 2000g.
- Second is software pre-processing using python emulation software to verify the image processing algorithm.
- Third is the image processing algorithm testing on the iCE40 UltraPlus MDP board.

AMR Algorithm Overview
The image processing algorithm is based on Intensity (grid) based threshold methodology. A five stage process is followed:
- Image565 to Image888 format
- Image888 to Grayscale format
- Grayscale format to Binary Scale format
- Mask and Weight Computation (Summation of binary pixel count in each processing grid – Golden Black count Value)
- Background data subtraction for each grid checks whether it crosses a threshold to detect the needle position
AMR Implementation pipeline

The block level AMR implementation within the FPGA is shown in Figure 4. It has three main modules – Camera control module, Image processing module and Transmission module. The camera control module sends control signals to the camera for initialization. The Camera sensor (OVM7692 ) connected to the FPGA captures images of the meter. These images are sequenced by the Camera control module and then send to the image processing module. The image processing module processes the received image and sends the results to the Transmission module. The Transmission module then transmits the result externally using a communication protocol. The distance between the camera and the meter face is pre-calibrated and fixed.
Camera Control Module
The function of this module is to send control signals to the camera and receive image pixels from the camera.

As shown in Figure 5, the camera sensor OVM7692 is a 16bit RGB sensor. It sends 8 bits of a pixel at a time with href and vsync signals. When the camera controller initializes the sensor, it starts sending pixels to the module. The data capture module collects pixels and combines them into a 16 bit RGB pixel. The data capture also generates a pixel ‘valid’ signal along with each pixel’s {x,y} position.
Image Processing Module
This module receives signals from the camera control module and processes pixels as per the angle based needle detection algorithm.
The algorithm is based on grid formation for an image frame. The grids of pre-decided width and height are overlaid over the image. Then as a pre-processing task, the grid positions are selected where the meter needle can be present. The angle of each selected grid with respect to a decided grid is calculated. Then each grid’s meter reading is decided according to its angle. Text files containing a list of grid positions are generated.
As a part of pre-processing, a text file of golden reference values is also generated. While testing a frame, we have to count all black pixels (convert 16 RGB to grayscale and then depending on a threshold, convert it again to a binary image. The binary image only has black and white pixels) for a grid and subtract the count from the golden reference values for the corresponding grid. When subtraction for a grid is more than a threshold then the reading corresponding to the grid is considered. All the readings crossing the threshold are averaged and that average is considered as the final reading of the meter for a particular frame.
The RTL implementation of this module is as shown in Figure 6.

Transmission Module
The role of this module is to send meter readings, computed by the image processing module, to an external sink (eg: LCD display in production deployment or a PC during testing) via UART. It receives BCD value from the image processing module, converts each nibble into its ASCII code and sends via UART. Figure 7 shows the block diagram for the transmission unit.

AMR Results
The algorithm is validated twice before hardware testing. The first validation in software testing using python emulation and the second validation is using Active-HDL simulation testing. The AMR implementation is done for cell grid size 4 and 8 with results shown in Table 1. The results of FPGA utilization of LUTs are 51% for cell grid size 8 and 91% for cell grid size 4.
The gradation accuracy is
±30g±30g
for cell grid size 8 and for cell grid size 4 is
±10g. ±10g.
Thus, cell grid size 4 is better compared to cell grid size 8.

Conclusion
The complete end to end pipeline of this image processing algorithm, specifically built for AMR applications, is developed completely in RTL by the Ignitarium team. An implementation purely in hardware allows high performance deployment in a very low-power battery operated FPGA such as the highly capable Lattice iCE40 UltraPlus FPGA. This pipeline can be easily customized for various other analog meter reading applications such as water meter, pressure gauge etc.
As extension to the work described in this article, Ignitarium has AI-enhanced computer vision solutions for automatic reading of combo Analog & Digital meters.